Collectors' Five Step Card Price History: Read PSA Pop and Sold Comps
By Ripbin Research · Published 2026-09-12

Collectors’ Five Step Card Price History: Read PSA Pop and Sold Comps
Price history reveals whether a card’s current value reflects real, durable demand or a temporary spike, and the fastest way to check is comparing median sold comps from the last 60 to 90 days against PSA population data. Look at both together, not one alone: median sold comps tell you what buyers are actually paying, and the PSA Population Report tells you how many copies exist at each grade. A rising median with a flat or shrinking gem rate usually signals a price likely to hold.
TL;DR:
- Comparing median sold prices from the last 60 to 90 days with PSA population data helps verify if current card values are supported by demand and supply.
- Raw sold listings provide the most immediate demand signals but can be distorted by outliers or rigged auctions, while price guides show trend lines without raw transaction volatility.
- A low gem rate under 10% combined with minimal population growth indicates authentic scarcity likely to sustain a price premium, but always confirm sufficient sales volume.
- Adjust your price window based on trading frequency: 30 days for high-volume modern cards, up to 180 days for vintage or low-trade cards, and widen if sales are sparse.
- Automated platforms like Ripbin streamline this analysis by integrating live comps with population data for quick, reliable valuation before buying or selling.
Table of Contents
- Where to Find Reliable Price History Cards Data
- How to Read a Price Chart Without Getting Fooled
- How Population Reports Reveal Scarcity and Grade Premium
- Building a Statistical Method You Can Trust
- A Five-Step Check Before You Buy, Sell, or Grade
- Common Pitfalls Even Experienced Collectors Miss
- How Ripbin Turns Price History Into a Faster Decision
- Sources
- FAQ
Where to Find Reliable Price History Cards Data
Every serious pricing decision starts with picking the right data source, and each one answers a different question. Raw sold listings show you real transactions. Price guides clean that data into readable charts. Population reports tell you supply.
- Marketplace sold comps (eBay sold) give you timestamped, unfiltered demand data straight from actual buyers. This is the rawest signal available, and it is also the noisiest, since a single desperate buyer or a rigged auction can distort one data point.
- Price-guide databases turn that raw data into cleaner historical price charts, usually showing market price, lowest active listing, and median sold price side by side. TCGplayer’s price guide is a good example of a service that layers multiple pricing metrics onto one interactive chart, which makes spotting trends far easier than scrolling through individual sales.
- PSA population reports function as a supply ledger. They will not tell you what a card sold for, but they tell you how many exist at each grade, which matters just as much.
Use raw sold listings when you need the most current, unfiltered read on demand, especially for cards that trade daily. Use a price-guide database when you want the trend line without the manual math, and check pop reports separately since they update on their own schedule, typically monthly.
How to Read a Price Chart Without Getting Fooled
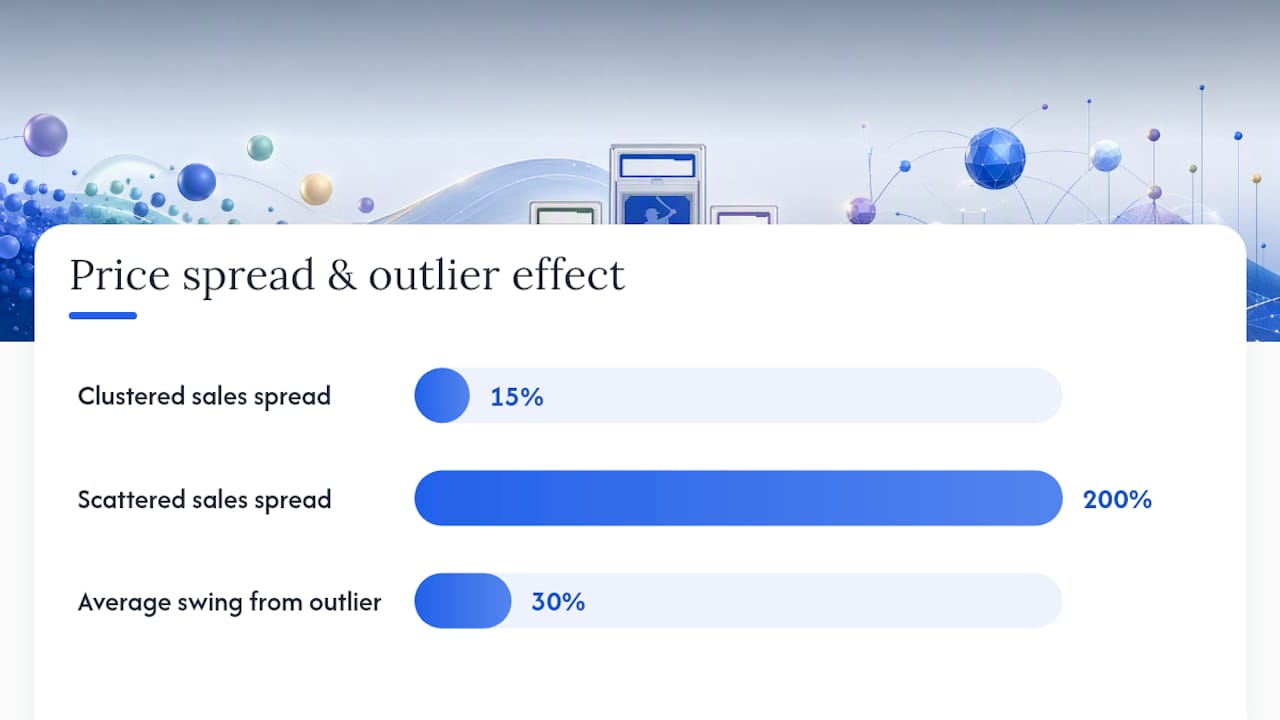
The median line matters more than any single sale, because one outlier auction can swing an average by 30% or more while barely moving the median. When you pull up a chart, ignore the highest and lowest points first and find where the bulk of sales cluster.
Sales volume and spread tell you how much to trust that median. A card with 40 sales in the last 60 days clustered within a 15% price band is a far more reliable read than a card with 6 sales scattered across a 200% range.
- Check volume first: more sales in the window means more confidence in the median.
- Check spread second: a tight cluster of prices means the market agrees on value; a widespread means it does not.
- Check for spikes tied to events: a tournament win, a milestone game, or a viral moment can double a price overnight, and that price often drifts back down within weeks once attention fades.
- Compare a 30-day window against a 180-day window on the same card. If the short-term number is dramatically higher, you are probably looking at a bubble, not a shift.
Statistic Callout: A median-of-window approach adapted from 30 to 180 days depending on card type produces more reliable price anchors than single comps, because it smooths out one-off outlier sales that skew a simple average.
How Population Reports Reveal Scarcity and Grade Premium
PSA population data shows the total number of copies graded at each level, from PSA 1 through PSA 10, plus the running total across all grades. What it does not show is anything outside PSA’s own vault. Cards graded by other companies, and raw copies never submitted, are invisible to this report.
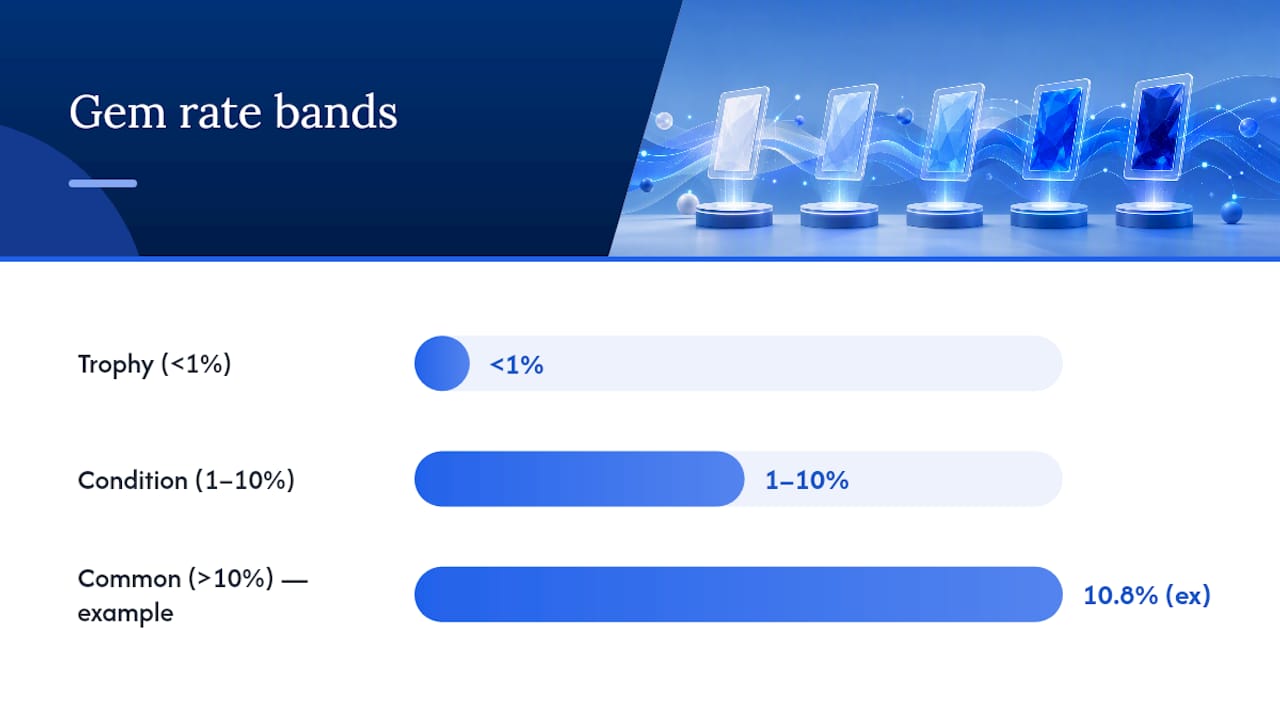
Gem rate is the number that turns pop counts into a scarcity signal. The formula is simple: (PSA 10 population divided by total graded) times 100. A card with 342 PSA 10s out of 3,156 total graded sits at a 10.8% gem rate, which is right at the edge of meaningful scarcity.
| Gem rate band | What it typically means |
|---|---|
| Under 1% | Trophy-level scarcity, often a strong price premium |
| 1% to 10% | Real condition scarcity, premium usually durable |
| Over 10% | Common in top grade, premium tends to be modest |
Pop growth velocity matters just as much as the current snapshot. Calculate it by subtracting the total graded three months ago from today’s total, then dividing by three. Above 5% a month means the population is expanding fast, which tends to erode grade premiums as more copies enter circulation. Never act on pop counts alone. A scarce card with almost no sales volume is not automatically valuable; it might just be unwanted.
Building a Statistical Method You Can Trust
Comp windows should flex with how often a card actually trades. A high-volume modern card can be priced accurately off the last 30 days. A graded modern card, where sales happen less often, usually needs 60 days to gather enough data. Serial-numbered parallels and low-print insert cards often require 90 days, and vintage cards can need a full 180-day window just to find a handful of comparable sales.
- Pull every sold comp inside your chosen window, filtered to the exact card, parallel, and grade.
- Use the median, not the mean. A mean gets pulled around by a single high or low outlier; a median does not.
- If you have fewer than 5 to 8 comps, widen the window before trusting the number.
- Score your confidence based on three factors: sample size, price spread, and how recent the sales are.
- For one-of-one cards or superfractors, medians do not apply at all; use the last verified sale or a cross-parallel comparison instead.
Pro Tip: When a card has fewer than five comps in your target window, resist the urge to average what little you have. Widen the window first, and treat any number you generate as a rough band, not a precise figure, until more sales come in.
A Five-Step Check Before You Buy, Sell, or Grade
Run this before any transaction that matters, and it takes less time than reading a single auction listing top to bottom.
- Confirm the exact variant. Card year, set, parallel, print run, and target grade all need to match before you pull a single comp. A base card and its refractor parallel are not the same market.
- Pull median sold comps for that exact variant and grade, using the comp window appropriate to how often it trades.
- Check the PSA population report. Calculate gem rate and pop growth velocity for the target grade.
- Build a pricing band, not a single number, using the median adjusted up or down based on your confidence score.
- Decide, and set a re-check date. Buy, hold, sell, or send it in for grading, and schedule another look in 30 to 90 days depending on volatility.
Pro Tip: Cards that combine low gem rate and low pop growth velocity are the ones worth watching closest. That combination is a stronger signal than either metric alone, and it is exactly the kind of pattern Ripbin’s monthly buy reports are built to surface.
Common Pitfalls Even Experienced Collectors Miss
The biggest mistake is trusting one sale, or worse, mixing raw and graded comps into the same median as if they belong together. They do not. Pop reports are the closest thing the hobby has to a supply ledger, but supply without demand data tells you almost nothing. Sometimes the math says hold, but a tax deadline, a liquidity crunch, or plain attachment to a card justifies ignoring the model. Data should guide the decision, not replace judgment entirely.
— Saad
How Ripbin Turns Price History Into a Faster Decision
Pulling median comps by hand, cross-referencing them against PSA pop counts, then calculating gem rate and growth velocity yourself works, but it eats an evening per card.
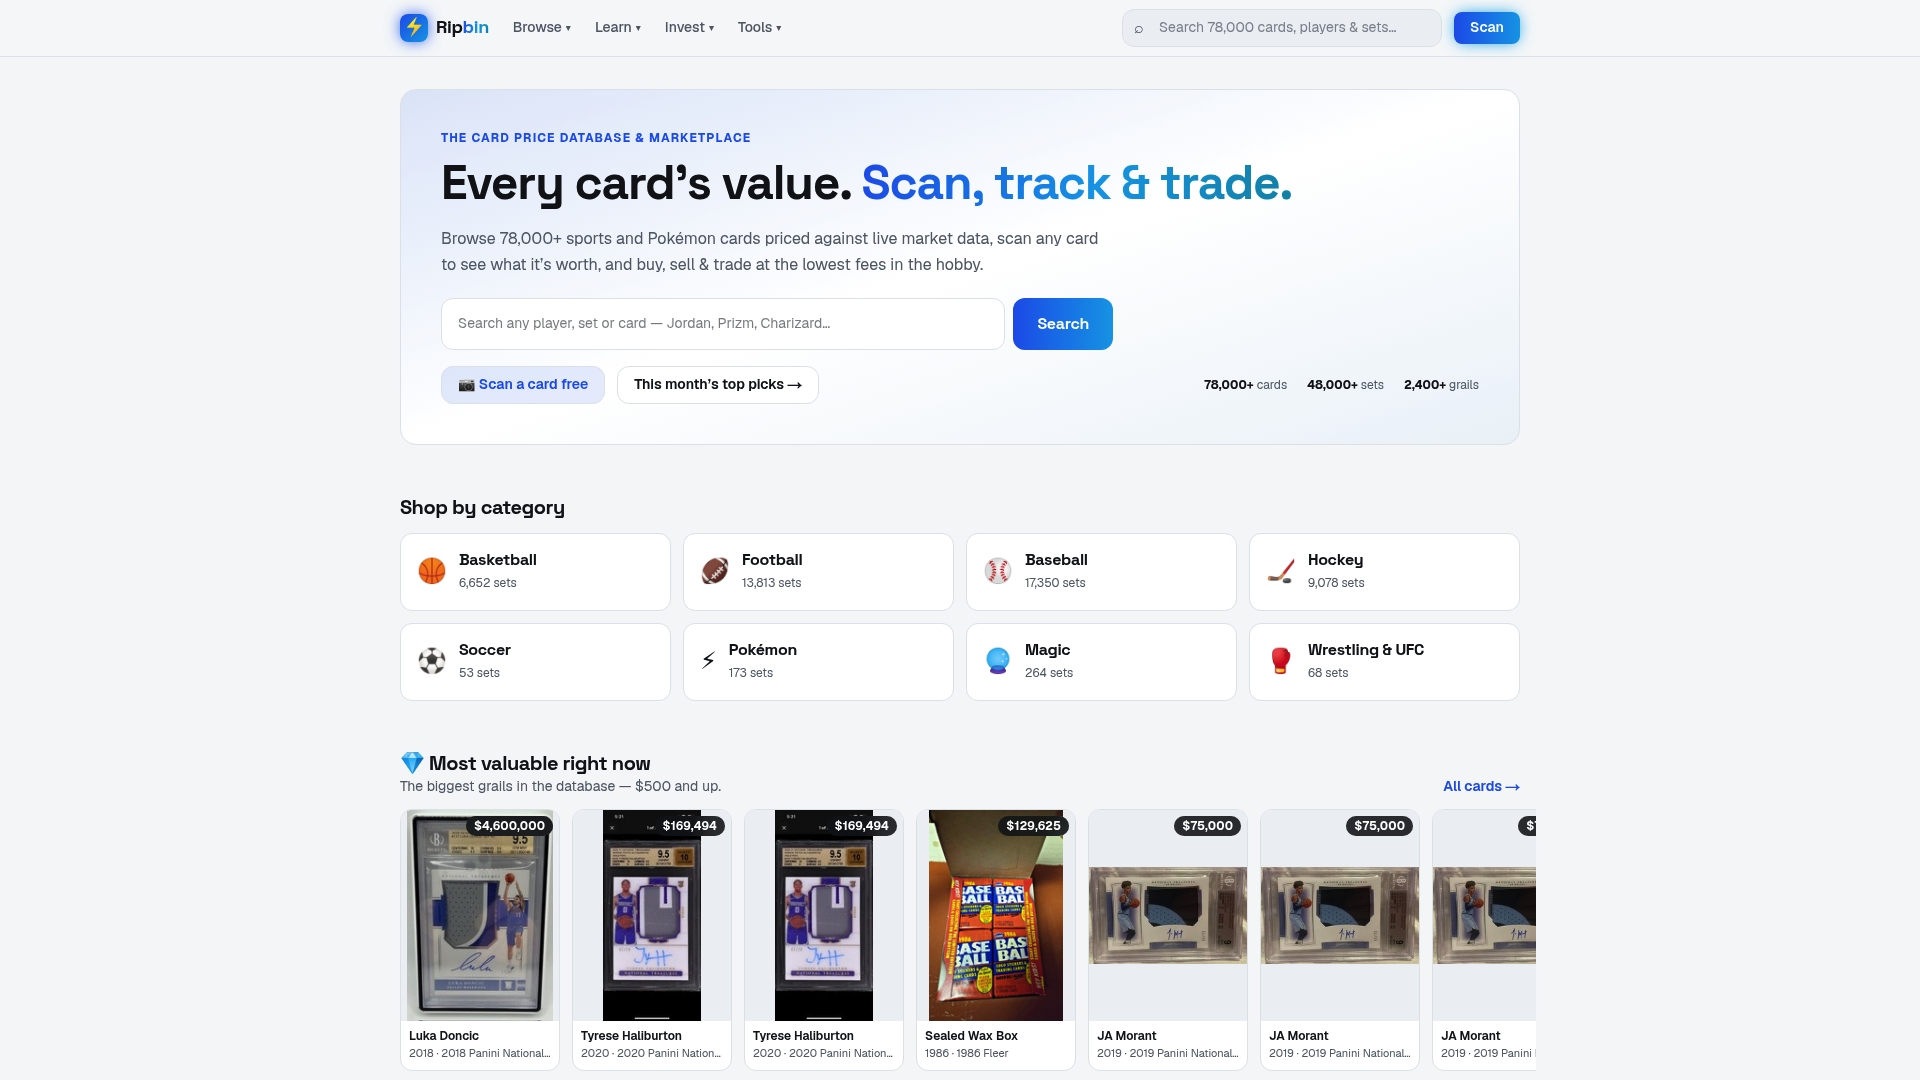
Some platforms run that same workflow automatically across many cards, pairing live market values sourced from real sales with grade-aware historical charts, so the median-and-pop cross-check described above happens in seconds instead of hours. Snap a photo with the built-in scanner for an instant value read, store the card in your personal locker to track it over time, and check the monthly buy reports for cards where scarcity and demand are already lining up. Some platforms allow browsing card data without fees. Start by browsing the full card database for the exact variant and grade you’re evaluating, and run your own check before your next buy or sell.
Sources
- PSA Population Report
- PSA Population Report Guide 2026: How to Read & Use Pop Data
- TCGplayer Price Guide: How to Value Trading Cards in 2026 – Buy Any Cards
FAQ
What Is the Difference Between Price History and Sales History?
Price history refers to the charted trend of a card’s value over time, usually built from a median of sold comps. Sales history is the underlying list of individual transactions that data gets pulled from.
How Often Does PSA Update Its Population Report?
PSA population counts update as new submissions get graded and returned, typically shifting on a monthly basis, which is why tracking pop growth velocity month over month matters more than checking a single snapshot.
What Comp Window Should I Use to Price a Card?
Use 30 days for high-volume modern cards, 60 days for graded modern cards, 90 days for serial-numbered parallels, and up to 180 days for vintage or thinly traded cards, widening whenever your sample falls below 5 to 8 sales.
Is a Low Gem Rate Always Good for Price?
A gem rate under 10% signals real condition scarcity and usually supports a price premium, but only when sales volume confirms actual demand for that grade; scarcity without buyers does not move price on its own.
Can I Check Price History Without Manually Pulling Comps?
Yes. Platforms like Ripbin combine live sold-comp data with PSA pop tracking in one chart, so you see median price trends and population shifts without building the spreadsheet yourself.