Collectors: Card Price Guide Using Sold Comps & Population Data
By Ripbin Research · Published 2026-10-06

Collectors: Card Price Guide Using Sold Comps & Population Data
The most accurate card valuations come from price guides that combine recent sold-transaction history, grade-by-grade tables, and population (grade rarity) data. Static “book value” lists lag the real market, while guides built on actual sold comps and PSA population reports catch price swings as they happen. The strongest tools also let you scan a card, pull its grade-specific comps, and see net payout after fees before you buy or sell.
TL;DR:
- Price guides that incorporate recent sold-transaction data, grade-specific pricing, and population reports accurately reflect the current market value.
- Using a two-year rolling window of recent sales minimizes noise from outliers and captures short-term market trends effectively.
- Grade normalization and population scarcity are key factors; a PSA 10 can differ in value by ten times from a PSA 8 of the same card.
- Net payout calculations account for fees, shipping, and taxes, preventing overestimation of actual profit during buying or selling.
- Regional price variations and market liquidity should influence pricing decisions, as local demand and supply can skew value estimates.
Table of Contents
- How modern card price guides work
- Checklist: what the best card price guides and valuation tools offer
- Step-by-step: pricing a card with sold comps, population data, and fee math
- Limitations and pitfalls that distort card valuations
- What a live sold-data database adds to the valuation process
- Understanding regional price variations and their impact on card values
- How to use price guides for buying vs. selling decisions
- Data-first valuation serves collectors and investors alike
- Get started with Ripbin: scan, value, track, and trade
- FAQ
- Sources
How modern card price guides work
Every price guide answers the same question differently: what does this card actually sell for? The guides worth trusting answer it with sold-transaction data instead of a static list someone typed up once and rarely updates.
Sold values versus book values come from different philosophies. A book value is an editor’s estimate, often revised on a slow cycle and blind to short-term swings in demand. A sold-transaction value is pulled directly from completed sales, so it moves with the market in near real time. When a player has a big week or a set gets reprinted, sold data reflects that within days, not months.
Most reliable guides source their numbers from a mix of:
- eBay sold listings, which make up the largest volume of everyday card sales and now feed directly into eBay’s own price guide and scanning tool, which aggregates two years of sold-transaction history.
- Auction house results, which carry weight for high-end cards but can skew toward outliers since they tend to attract the best-known copies.
- Peer-to-peer marketplace transactions, which fill in gaps between major auctions and eBay, particularly for mid-tier cards that do not generate headline sales.
Aggregation matters as much as the raw data. A guide that averages every sale from the last five years will smooth out short-term spikes but miss a card’s current momentum. A guide that only looks at the last 30 days can overreact to a single outlier sale. Most dependable tools split the difference: a rolling window of recent sales, weighted toward the most recent transactions, with older outliers flagged or excluded.
Timeframe choice changes the picture more than collectors expect. A two-year window, like the one eBay’s updated guide uses, captures enough sales to smooth out noise while staying responsive to recent shifts in demand. A card that’s quietly doubled in value over six months will show that trend in a two-year chart; it gets buried in a longer five-year average.
Grade normalization is the piece that trips up casual sellers the most. A raw card, a PSA 8, and a PSA 10 of the same exact card can differ in price by 10 times or more, so any guide worth using must present values grade by grade rather than as a single blended number. Without that breakdown, you’re comparing apples to a fruit basket. A guide that shows “card X: $150” without specifying the grade is functionally useless for setting a real price, because the grade is often the single biggest driver of what a card is worth.
Checklist: what the best card price guides and valuation tools offer
Not every price guide serves the same purpose, and the features that matter shift depending on whether you’re a hobbyist tracking a childhood collection or an investor managing a portfolio. Use this checklist to match a tool to your actual goal.
- Real-time sold-transaction history with grade filters. You should be able to pull recent sales for a specific grade, not a blended average across every condition.
- Grade-by-grade pricing tables. Look for a breakdown by grade (raw, PSA 7 through 10, BGS equivalents) rather than a single headline number.
- Population and gem-rate visibility. A tool that shows how many copies exist at each grade helps you judge whether a price premium is justified by real scarcity. Population reports reveal grade-specific scarcity that a simple print-run number never captures.
- Exact-card identification. Scan or photo-based ID that distinguishes variations, parallels, and print runs prevents you from pricing the wrong card entirely.
- Historical charting and exportable evidence. A visual price history, plus the ability to export or screenshot comps, matters if you ever need to justify a price to a buyer or seller.
- A transparent data-sourcing note. The guide should say where its numbers come from and how often they refresh, rather than presenting prices as unexplained facts.
- A net-payout calculator. Fees, shipping, and taxes eat into any sale; a tool that shows what you’ll actually pocket is more useful than one that only shows a gross price.
- Collection management and mobile scanning. For ongoing tracking, a locker-style collection view with scan-to-add functionality saves hours compared to manual spreadsheets.
Pro Tip: Before trusting any single number, check whether the guide shows the underlying comps. A price with no visible sales behind it is an opinion, not data.
Hobbyists who just want a rough sense of a collection’s value can lean on fewer features: grade-by-grade pricing and basic sold comps usually cover it. Investors making buy or sell decisions on meaningful money should prioritize population data, historical charts, and fee math, since those are the features that separate a defensible price range from a guess.
Step-by-step: pricing a card with sold comps, population data, and fee math
Turning raw data into a price you’d actually quote someone takes a consistent process. Here’s the sequence that produces a defensible range rather than a single made-up number.
- Confirm the exact card. Identify the set, year, card number, and any variation or parallel using a scan tool or an exact-match lookup. A single wrong detail, like mistaking a base card for a refractor, invalidates every comp you pull next.
- Pull recent sold comps for that exact grade. Filter listings to the specific grade you’re pricing, not an average across conditions. Aim for multiple recent sales rather than relying on one.
- Check population data for that grade. A population report tells you how rare that specific grade is relative to the total number graded. A card with a large print run but very few PSA 10s will command a premium at that grade even if lower grades are common.
- Calculate net payout. Subtract marketplace fees, shipping costs, applicable taxes, and any buyer-premium or consignment fees from the gross sale price. This step is where a lot of collectors miscalculate their actual profit.
- Set a low, median, and high range. Use your weakest comparable sale as the low end, your strongest recent comp as the high end, and the middle of your filtered comps as the median. Document which sales support each number so you can defend the range later.
Statistic Callout: Recent reporting on the highest-value card sales shows that the ten biggest public card sales have clustered within the last five years, spanning both sports and trading card games. That clustering is a reminder that headline sales are often outliers, not a baseline for pricing your own card.
Say a 1986 Fleer Michael Jordan rookie in PSA 8 has five recent sold comps ranging from $1,800 to $2,400, with a median around $2,100. That net figure, not the gross sold price, is the number that should guide whether the deal makes sense.

Limitations and pitfalls that distort card valuations
Even good data can mislead you if you don’t account for how markets actually behave.
- Small samples get skewed by outliers. A card with only two or three recent sales can show a wildly different “value” depending on which copies happened to sell, especially if one was a marquee auction result. The top sales rankings make for great headlines but rarely represent what an average copy will fetch.
- Production scarcity isn’t the same as condition rarity. A set with a huge print run can still have very few copies surviving in top grade, which is why population reports matter more than the original print run when you’re pricing a specific grade.
- Manipulated listings distort comps. Shill bidding, bundled sales disguised as single-card sales, and mislabeled grades can all inflate what looks like a clean comp. Cross-check seller history and photos before trusting a sale as evidence.
- Thin markets create wide spreads. A card with low trading volume might show one sale at $500 and another at $900 with nothing in between; that spread reflects liquidity, not a pricing error, and you should widen your range accordingly rather than anchoring to either extreme.
- Fee math turns “profitable” sales into losses. A card that sold for more than you paid can still be a loss once shipping, grading costs, and marketplace fees are subtracted, so always calculate net payout before celebrating a gross number.
Owners also tend to anchor to what they paid rather than what the market says a card is worth now, a pattern consistent with the endowment effect, which describes why people routinely overvalue things they already own.
What a live sold-data database adds to the valuation process
A price guide is only as useful as the data feeding it and how quickly that data updates. We built Ripbin around live market data covering more than 78,000 cards, pulled from actual sales rather than static estimates.
- Scan a card and get an identification match along with its current grade-by-grade values, pulled from recent sold transactions rather than a fixed list.
- Check population and gem-rate context alongside the price, so a PSA 10 premium is explained by actual grade scarcity rather than a guess.
- See an estimated net payout before listing, accounting for marketplace fees, so the number you’re working with reflects what you’d actually keep.
- Track an entire collection in a locker view that updates as market values shift, instead of re-checking each card manually.
- Review monthly, data-driven buy reports and value guides by player and set, which translate raw sold-comp data into specific picks and reasoning.
Pro Tip: Run the same card through a scan-and-comp workflow twice, a week apart, if the price looks unusually high. A genuine trend will hold; a one-off spike from a single outlier sale usually won’t.
The point of combining scan, comps, population, and payout math in one workflow isn’t to replace judgment, it’s to make sure the judgment you apply is based on current, verifiable sales rather than a number that was accurate six months ago.
Understanding regional price variations and their impact on card values
Card prices aren’t uniform across every market, even within the same country. Local demand for a specific player or team can push prices above the national average in that player’s home region, while the same card might sell for less where local interest is thinner. Shipping costs and regional marketplace fees also factor in, since a seller closer to a concentration of buyers for a given card often nets more after costs than one shipping across the country.
Grading turnaround times and submission costs can vary by region too, which affects how many high-grade copies enter circulation from a given area at a given time. This matters when you’re comparing population data: a sudden jump in PSA 10 population for a card might reflect a regional grading push rather than a change in how common the card actually is.
When you’re pricing a card, it helps to pull comps from a broad pool rather than anchoring to listings from a single seller or region. A price guide that aggregates sales nationally, rather than relying on a handful of local listings, gives you a more representative range and protects you from treating a regional quirk as a market-wide trend.

How to use price guides for buying vs. selling decisions
Price guides serve buyers and sellers differently, even though they’re pulling from the same data.
As a buyer, your goal is to identify when an asking price sits above the recent sold-comp range, and by how much. If a listing is priced well above the median of recent sales for that exact grade, that gap is your negotiating room, or your signal to walk away if the seller won’t budge. Checking population data also helps you judge whether a premium is justified by genuine grade scarcity or just optimistic pricing.
As a seller, the same data works in reverse: price at or slightly below the recent median for your grade if you want a faster sale, or near the high end of the range if you’re patient and the comps support it. Sellers should also run the net-payout math before listing, since a price that looks competitive on the sold-comp chart can still leave you with a thin margin once fees and shipping come out.
In both cases, the sold-comp range, not a single headline number, should anchor the decision. A guide that only shows one price per card leaves you guessing at exactly the moment you need the most precision.
Data-first valuation serves collectors and investors alike
Static book values feel authoritative because they’re printed as a single number, but a single number hides more than it reveals. Sold comps paired with population transparency show you the actual range a card trades in and why, which is a more honest answer even when it’s a less tidy one.
Collecting for love and investing for return aren’t opposed, but they call for different discipline. Write down the comps and population data behind any price you believe, and revisit that belief as new sales come in rather than treating an old number as permanent.
— Saad
Get started with Ripbin: scan, value, track, and trade
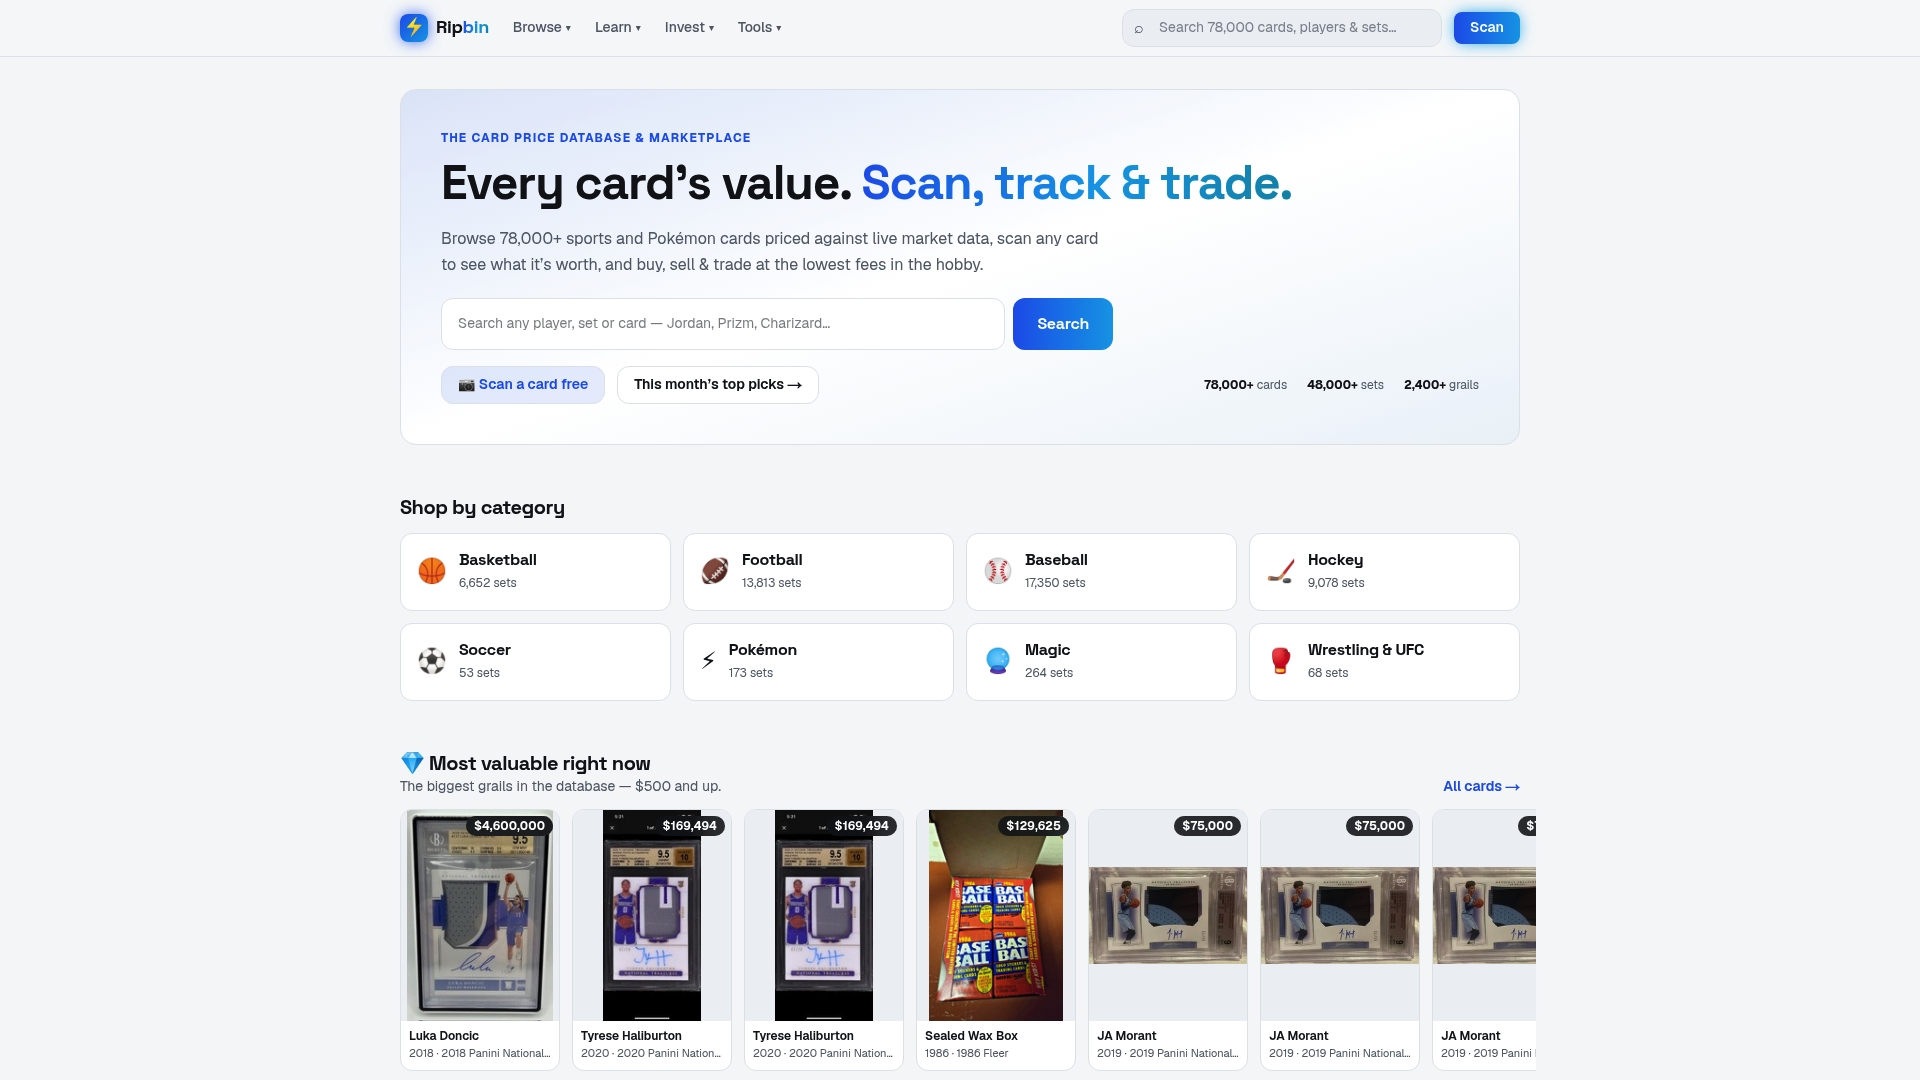
We built our platform so you can move from “what’s this worth” to a confident number in minutes. Scan a card to get instant identification and grade-specific values pulled from recent sold transactions. Check population data alongside the price, and see an estimated net payout before you list, so the number you’re working from accounts for fees.
- Scan a card from your collection to get its current grade-by-grade value.
- Pull recent sold comps and population data for that exact grade before setting a price.
- Browse sets and values to compare your card against similar listings.
- Read our investment guide if you’re building a portfolio rather than pricing a single card.
Start by heading to Ripbin and scanning your first card. From there, our live sold-data and population context make it easy to decide whether to hold, list, or make an offer with real numbers behind the decision.
This article is general information, not a substitute for advice from a qualified financial advisor. Consult a qualified financial professional about your own circumstances before acting on anything here.
FAQ
What makes a card price guide accurate?
Accuracy comes from using recent sold-transaction data rather than static estimates, broken out by grade, with population data to explain scarcity. Guides that blend these three elements track real market conditions far more closely than a single blended “book value” number.
Should I trust eBay sold listings over a printed price guide?
Sold listings reflect what buyers actually paid, which tends to be more current than a printed guide revised on a slow schedule. eBay’s price guide aggregates two years of sold-transaction history alongside scanning, making it a practical starting point for recent comps.
Why do two cards with the same grade sell for different prices?
Population differences, variation details, and timing of the sale all play a role even when the grade matches. A population report can show that one card has far fewer copies at that grade, which alone explains much of the price gap.
How often should I check a card’s value?
Check before any buy or sell decision, and periodically if you’re holding a card as an investment, since sold comps can shift within weeks for actively traded cards. A live-data tool that updates from recent sales removes the guesswork of deciding when a price is stale.
Can I use a price guide to value my whole collection at once?
Yes, many tools let you scan or add cards individually to a collection view that pulls current grade-by-grade values for each one. This gives you a running total based on recent sold data rather than a one-time estimate that goes stale.
Sources
- PSA population reports and their valuation importance (SportsCollectorsDigest)
- Top 10 most expensive card sales of all time (Sports Illustrated)